Security breaches rarely happen because attackers are smarter than defenders. They happen because defenders didn’t know where to look.
That’s precisely the problem that Threat Modeling Data Flow Diagrams (DFDs) solve.
A DFD gives your entire team ; developers, architects, security engineers, and product managers ; a shared visual map of how data moves through your system. It exposes trust boundaries, entry points, data stores, and the exact paths an attacker could exploit. Without it, your threat modeling is essentially guesswork.
According to OWASP, DFDs are the most widely used diagramming technique in threat modeling, and they form the foundation of industry-standard methodologies like STRIDE, PASTA, and LINDDUN. Microsoft, NIST, and ISO 27001 all reference DFDs as a core component of secure system design.
In this guide, you’ll learn:
- What a threat modeling DFD is and how it differs from other diagrams
- The 5 core DFD elements and their symbols
- DFD levels (Level 0, 1, and 2) and when to use each
- A step-by-step process for creating a DFD from scratch
- How to apply STRIDE and PASTA to your DFD
- Real-world DFD examples across multiple industries
- The best DFD tools available today
- How to integrate DFDs into Agile and DevSecOps pipelines
- DFD threat modeling for cloud, microservices, and IoT
- Regulatory compliance requirements (ISO 27001, GDPR, CRA)
- Limitations of DFDs and best practices
Whether you’re a security engineer building your first threat model or a DevSecOps professional looking to scale the practice across your organization, this guide covers everything you need.
Certified Threat Modeling Professional
Learn STRIDE, PASTA, VAST & RTMP frameworks in one certification.

What Is a Threat Modeling Data Flow Diagram?
A Data Flow Diagram (DFD) in the context of threat modeling is a structured visual representation that shows how data moves through a system, from external actors, through processes, into data stores, and back out again, while explicitly marking the trust boundaries where security controls must be enforced.
Unlike a general system architecture diagram, a DFD is purpose-built for security analysis. It doesn’t show infrastructure details like server specs, network topology, or deployment configurations. Instead, it focuses on data movement and trust relationships, the two things that matter most when identifying threats.
The goal of a threat modeling DFD is simple: make the invisible visible. It forces your team to answer critical questions:
- Where does sensitive data enter the system?
- Who or what can access it at each stage?
- Where are the trust boundaries between components?
- What happens to data when it crosses those boundaries?
DFD vs. Architecture Diagram: What’s the Difference?
This is one of the most common points of confusion for teams new to threat modeling.
| Aspect | Data Flow Diagram (DFD) | Architecture Diagram |
| Purpose | Security analysis and threat identification | System design and infrastructure planning |
| Focus | Data movement and trust boundaries | Components, services, and infrastructure |
| Audience | Security engineers, developers, architects | Developers, DevOps, infrastructure teams |
| Detail level | Abstracted ; shows logical flows | Detailed ; shows physical/logical infrastructure |
| Symbols | 5 standardized elements | Varies (AWS icons, UML, etc.) |
| Used in | Threat modeling, security reviews | System design, capacity planning |
An architecture diagram might show that your application runs on AWS EC2 behind an Application Load Balancer with an RDS PostgreSQL database. A DFD, on the other hand, shows that a user (external entity) sends credentials to an authentication process, which reads from a user database (data store), with a trust boundary separating the public internet from the internal application zone.
Both are useful. But for threat modeling, the DFD is the right tool.
DFD vs. Process Flow Diagram (PFD): Which Should You Use?
A Process Flow Diagram (PFD) focuses on the sequence of operations or business processes ; it answers “what happens step by step?” A DFD, by contrast, focuses on data movement and trust ; it answers “where does data go and who can touch it?”
For threat modeling, DFDs are the standard. However, some advanced methodologies like VAST (Visual, Agile, and Simple Threat modeling) use PFDs alongside DFDs to capture both operational and data-centric threat perspectives. For most teams, starting with DFDs is the right approach.
Why DFDs Are the Industry Standard for Threat Modeling
DFDs have become the de facto standard for threat modeling for several reasons:
- Simplicity: Only 5 symbol types means anyone on the team can read and contribute to a DFD ; no specialized training required.
- Universality: DFDs are methodology-agnostic. They work with STRIDE, PASTA, LINDDUN, VAST, and OCTAVE.
- Threat surface visibility: By explicitly marking trust boundaries, DFDs make attack surfaces immediately visible.
- Hierarchical decomposition: DFDs can be created at multiple levels of abstraction, from a high-level context diagram down to individual process flows.
Regulatory acceptance: ISO 27001, NIST SP 800-154, and the EU Cyber Resilience Act all recognize DFD-based threat modeling as a valid security practice.
The 5 Core Elements of a DFD (With Symbols)
Every DFD ; regardless of the tool you use or the methodology you follow ; is built from exactly five types of components. This standardization is what makes DFDs so powerful: once you know these five elements, you can read and create any DFD.
1. External Entities (Interactors) ; The Rectangle
Symbol: A solid rectangle (sometimes labeled with a name)
What it represents: Any person, system, or organization that exists outside the scope of your system but interacts with it. External entities are the sources and destinations of data ; they initiate requests, receive responses, and represent the “edges” of your system boundary.
Examples:
- End users (customers, employees, administrators)
- Third-party APIs (payment gateways, OAuth providers, analytics services)
- External systems (partner integrations, legacy systems, IoT devices)
- Regulatory bodies or auditing systems
Security significance: External entities are inherently untrusted. Every data flow from an external entity into your system is a potential attack vector. When you see a rectangle in a DFD, your threat modeling mindset should immediately ask: “What could a malicious actor do if they controlled this entity?”
2. Processes ; The Circle or Rounded Rectangle
Symbol: A circle (Yourdon notation) or a rounded rectangle (Microsoft notation)
What it represents: Any component within your system that receives, transforms, or transmits data. Processes are the active components ; they do something with data. This could be a web application, a microservice, an API endpoint, a background job, or any piece of code that processes information.
Examples:
- Web application frontend
- Authentication service
- Payment processing module
- Data validation logic
- API gateway
- Background job scheduler
Security significance: Processes are where most application-layer vulnerabilities live. SQL injection, authentication bypass, business logic flaws, and privilege escalation all occur within processes. In STRIDE, processes are susceptible to Spoofing, Tampering, Repudiation, Information Disclosure, Denial of Service, and Elevation of Privilege ; all six threat categories.
3. Data Stores ; The Double Line or Database Symbol
Symbol: Two parallel horizontal lines (Yourdon notation) or a database cylinder (common in tools like draw.io)
What it represents: Any location where data is stored at rest within your system. Data stores are passive ; they don’t process data, they simply hold it. The key security question for every data store is: “Who can read from or write to this store, and is that access properly controlled?”
Examples:
- Relational databases (PostgreSQL, MySQL, SQL Server)
- NoSQL databases (MongoDB, DynamoDB, Redis)
- File systems and blob storage (S3, Azure Blob, local disk)
- Log aggregators (Elasticsearch, Splunk)
- Message queues (Kafka, RabbitMQ, SQS)
- Caches (Redis, Memcached)
- Session stores
Security significance: Data stores are high-value targets because they hold sensitive data at rest. Threats include unauthorized read access (information disclosure), unauthorized write access (tampering), and data destruction (denial of service). Encryption at rest, access controls, and audit logging are the primary countermeasures.
4. Data Flows ; The Arrow
Symbol: A directed arrow (→) showing the direction of data movement; bidirectional flows use a double-headed arrow (↔)
What it represents: The movement of data between any two components in the DFD. Every arrow represents a communication channel ; an HTTP request, a database query, a message queue event, a file read/write, or any other form of data exchange.
Best practices for labeling data flows:
- Include the protocol (HTTPS, TLS 1.3, gRPC, AMQP)
- Note the data type (user credentials, PII, payment data, session tokens)
- Indicate authentication method if applicable (JWT, API key, mTLS)
- Mark whether the channel is encrypted or unencrypted
Examples:
- User → Web App: HTTPS POST /login (username, password)
- Web App → Auth DB: SQL SELECT (encrypted connection)
- Payment Service → Payment Gateway: HTTPS/TLS 1.3 (card data, PCI DSS scope)
Security significance: Data flows crossing trust boundaries are the highest-risk elements in a DFD. Unencrypted flows, flows carrying sensitive data, and flows that cross from untrusted to trusted zones all warrant careful threat analysis. STRIDE threats like Tampering (MITM attacks) and Information Disclosure (eavesdropping) are primarily associated with data flows.
5. Trust Boundaries ; The Dotted Line
Symbol: A dashed or dotted line, often forming a rectangle or zone around components
What it represents: The boundary between two zones of different trust levels. When data crosses a trust boundary, the security assumptions change. Trust boundaries are arguably the most important element in a DFD because they define where security controls must be enforced.
Common trust boundaries:
- Internet (untrusted) vs. internal network (trusted)
- Public DMZ vs. private application tier
- Application tier vs. database tier
- User space vs. kernel space (in OS-level models)
- On-premises vs. cloud environment
- Your organization’s systems vs. third-party services
- Different microservices with different privilege levels
Security significance: Every data flow that crosses a trust boundary is a potential attack vector. Trust boundaries are where authentication, authorization, input validation, encryption, and logging controls must be applied. If a DFD has no trust boundaries, it’s incomplete, and your threat model will miss the most critical attack surfaces.
DFD Levels Explained: Level 0, Level 1, and Level 2
One of the most powerful features of DFDs is their hierarchical nature. You don’t have to capture every detail of your system in a single diagram. Instead, you build DFDs at progressively increasing levels of detail, starting with a high-level overview and drilling down into specific subsystems as needed.
Level 0 – The Context Diagram (Big Picture View)
A Level 0 DFD, also called a Context Diagram, shows the entire system as a single process (one circle or rounded rectangle) surrounded by all external entities that interact with it. It’s the 30,000-foot view.
What it shows:
- The system as a single black box
- All external actors (users, third-party systems, external services)
- The high-level data flows between external actors and the system
- The overall system boundary
When to use it:
- At the start of a threat modeling session to establish scope
- When communicating with non-technical stakeholders
- To identify all external dependencies and integration points
- As the first step before decomposing into Level 1
Example ; E-commerce Platform Context Diagram:
- External entities: Customer, Payment Gateway, Shipping Provider, Admin User, Email Service
- System: E-commerce Platform (single process)
- Data flows: Order requests, payment data, shipping confirmations, admin commands, email notifications
Level 1 – System Decomposition
A Level 1 DFD breaks the single system process from Level 0 into its major subsystems or functional components. This is where you start to see the internal structure of the system and where trust boundaries between components become visible.
What it shows:
- Major application components (frontend, backend, authentication service, payment module, etc.)
- Data stores (databases, caches, file storage)
- Data flows between internal components and external entities
- Trust boundaries between major zones (internet, DMZ, internal network, database tier)
When to use it:
- For most threat modeling sessions ; this is the “sweet spot” level
- When you need to identify threats at the component level
- When applying STRIDE-per-element methodology
- For security architecture reviews
Example ; E-commerce Platform Level 1:
- Processes: Web Frontend, Order Management Service, Payment Processing Service, User Authentication Service, Inventory Service
- Data Stores: User Database, Order Database, Product Catalog, Session Store
- Trust Boundaries: Internet zone, Application zone, Database zone
Level 2 – Process-Level Detail
A Level 2 DFD decomposes individual processes from Level 1 into their internal sub-processes. This is the most detailed level and is typically only created for high-risk or complex components.
What it shows:
- Internal logic of a specific process (e.g., the Authentication Service broken into: Input Validation → Credential Lookup → Token Generation → Session Creation)
- Fine-grained data flows within a component
- Internal data stores (in-memory caches, temporary files)
- Micro-level trust boundaries
When to use it:
- For high-risk components that warrant deep analysis (authentication, payment processing, admin functions)
- When a Level 1 threat analysis reveals a component with many potential threats
- For compliance purposes where detailed documentation is required
- When performing code-level security reviews
When to Stop: Choosing the Right Level of Abstraction
A common mistake in threat modeling is going too deep too quickly. Here’s a practical guide:
| Scenario | Recommended Level |
| New system, first threat model | Level 0 → Level 1 |
| Existing system, security review | Level 1 |
| High-risk component deep dive | Level 2 |
| Compliance audit documentation | Level 1 + Level 2 for critical components |
| Agile sprint threat modeling | Level 1 (focused on the feature being built) |
| Executive/stakeholder communication | Level 0 |
Rule of thumb: Start at Level 0 to establish scope, build Level 1 for your primary threat analysis, and only go to Level 2 for components where Level 1 reveals significant risk or complexity.
- Real-World DFD Examples for Threat Modeling
Theory is useful, but seeing DFDs applied to real systems is where the learning crystallizes. Here are four detailed examples across different domains.
Example 1 – Web Application Authentication Flow (OAuth2)
System: A SaaS application using OAuth2 for authentication with an external identity provider (e.g., Google, Okta, Auth0)
DFD Components:
- External Entities: User (Browser), OAuth2 Provider (Google/Okta)
- Processes: Frontend SPA, Backend API, Token Validation Service
- Data Stores: Session Store (Redis), User Profile Database
- Trust Boundaries:
- Internet Zone: User, OAuth2 Provider
- Application Zone: Frontend SPA, Backend API, Token Validation Service
- Data Zone: Session Store, User Profile DB
Key Data Flows:
- User → Frontend SPA: HTTPS | Browser request
- Frontend SPA → OAuth2 Provider: HTTPS | Authorization request (redirect)
- OAuth2 Provider → Frontend SPA: HTTPS | Authorization code
- Frontend SPA → Backend API: HTTPS | POST /auth/callback {code}
- Backend API → OAuth2 Provider: HTTPS | Token exchange {code, client_secret}
- OAuth2 Provider → Backend API: HTTPS | {access_token, id_token, refresh_token}
- Backend API → Session Store: TLS | Store session {session_id, user_id, token}
- Backend API → User Profile DB: TLS/SQL | Upsert user profile
Key Threats Identified:
- Authorization Code Interception (T: Tampering) ; Attacker intercepts the authorization code via redirect URI manipulation → Mitigation: PKCE (Proof Key for Code Exchange)
- Token Leakage (T: Information Disclosure) ; Access tokens stored in localStorage accessible via XSS → Mitigation: Store tokens in httpOnly cookies
- Session Fixation (T: Elevation of Privilege) ; Attacker fixes session ID before authentication → Mitigation: Regenerate session ID after successful login
OAuth2 Provider Impersonation (T: Spoofing) ; Attacker creates fake OAuth2
DFD Threat Modeling Tools You Should Know
The right tool can dramatically accelerate your threat modeling process. Here’s a comprehensive overview of the most widely used DFD threat modeling tools.
Microsoft Threat Modeling Tool (TMT)
Best for: Teams working in Microsoft/Azure ecosystems; organizations following SDL (Security Development Lifecycle)
Key features:
- Free, desktop-based tool (Windows only)
- Built-in STRIDE threat generation ; automatically suggests threats based on your DFD elements
- Pre-built stencils for common components (web apps, databases, Azure services)
- Generates threat reports in HTML and CSV format
- Supports custom threat templates
Limitations: Windows-only, no collaboration features, limited to STRIDE methodology, UI feels dated
Download: Microsoft Threat Modeling Tool
OWASP Threat Dragon
Best for: Open-source advocates, teams wanting a free cross-platform tool, OWASP methodology followers
Key features:
- Free and open-source (MIT license)
- Available as a web application and desktop app (Windows, macOS, Linux)
- Supports STRIDE threat modeling
- GitHub integration for storing threat models as code
- Clean, modern UI
- JSON-based threat model format (version controllable)
Limitations: Less automated threat generation than Microsoft TMT, smaller stencil library
Access: OWASP Threat Dragon
Threat Modeling as Code: pytm and Threagile
For teams that want to integrate threat modeling directly into their development workflow, Threat Modeling as Code tools allow you to define your DFD and threat model in code ; making it version-controllable, reviewable, and automatable.
pytm (Python Threat Modeling)
- Define your DFD in Python code
- Automatically generates DFD diagrams (using Graphviz) and threat reports
- Supports STRIDE threat library
- Integrates with CI/CD pipelines
- Open-source (MIT license)
- GitHub: OWASP pytm
from pytm import TM, Server, Datastore, Dataflow, Boundary, Actor
tm = TM(“E-commerce Threat Model”)
internet = Boundary(“Internet”)
app_zone = Boundary(“Application Zone”)
user = Actor(“Customer”, inBoundary=internet)
web_app = Server(“Web Application”, inBoundary=app_zone)
db = Datastore(“Order Database”, inBoundary=app_zone)
Dataflow(user, web_app, “HTTPS POST /order”)
Dataflow(web_app, db, “SQL INSERT order”)
tm.process()
Threagile
-
- YAML-based threat modeling for cloud-native architectures
- Generates DFD diagrams, threat reports, and risk tracking
- Built-in support for cloud components (AWS, Azure, GCP)
- Docker-based execution
- Open-source
- GitHub: Threagile
Real-World Example: The E-commerce Adventure
For instance, an online store where the user provides the credit card details and later, when the shipment is made, the payment processor will verify the details. A DFD of such a case will lay bare threats such as credit card skimming and order tampering. By analyzing these risks, the store can implement encryption, fraud detection systems, and secure data storage. Example of a Threat Modeling Data Flow diagram. 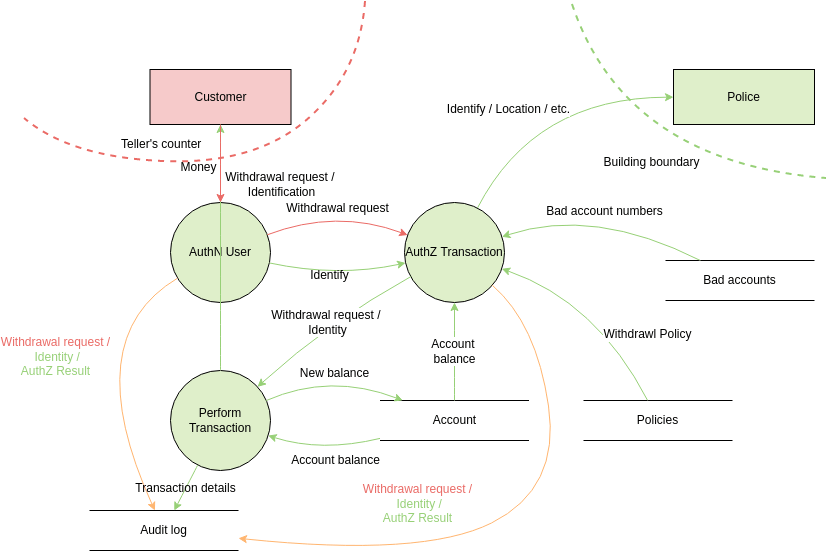
Also Read, Threat Modeling Best Practices
DFD Threat Modeling in Agile and DevSecOps Pipelines
One of the most common objections to threat modeling is: “We don’t have time for it in our sprints.” This objection usually comes from teams that think of threat modeling as a heavyweight, waterfall-era activity: a multi-day workshop that produces a 50-page document.
Modern DevSecOps threat modeling is different. It’s lightweight, iterative, and integrated directly into the development workflow.
The cost of finding a threat at design time vs. production:
- Design time: ~$80 to fix (architecture change)
- Development: ~$240 to fix (code change + testing)
- Testing: ~$960 to fix (code change + regression testing + re-testing)
- Production: ~$7,600+ to fix (emergency patch + incident response + potential breach costs)
DFD Threat Modeling for Cloud, Microservices, and IoT
Modern architectures present unique challenges for DFD-based threat modeling. The principles remain the same, but the application requires adaptation.
Challenges of DFDs in Cloud-Native Architectures
Cloud-native systems introduce several complexities that traditional DFD approaches don’t fully address:
- Shared Responsibility Model: In cloud environments, the trust boundary between your organization and the cloud provider is critical. AWS manages the hypervisor; you manage the OS and above. This boundary must be explicitly represented in your DFD.
- Ephemeral Infrastructure: Containers and serverless functions spin up and down dynamically. Your DFD needs to represent logical components, not specific instances.
- Managed Services: When you use AWS RDS, Azure Cosmos DB, or Google Cloud Pub/Sub, you’re trusting the cloud provider to secure the underlying infrastructure. This is a trust boundary that must be documented.
- IAM Complexity: Cloud IAM roles, service accounts, and cross-account access create complex trust relationships that are difficult to represent in traditional DFDs.
Limitations of DFDs in Threat Modeling
DFDs are powerful, but they’re not perfect. Understanding their limitations helps you use them more effectively and know when to supplement them with other techniques.
False Positives and False Negatives in DFD-Based Threat Models
False positives occur when your STRIDE analysis identifies threats that aren’t actually exploitable in your specific context. For example, flagging “SQL injection” as a threat on a data flow that only carries pre-validated, non-user-supplied data.
False negatives are more dangerous ; they occur when real threats are missed because the DFD doesn’t capture enough detail. Common causes:
- DFD is too high-level and misses important sub-processes
- Trust boundaries are incorrectly drawn
- External entities are missing (forgotten integrations, internal admin tools)
- Data flows are unlabeled, hiding the sensitivity of transmitted data
Mitigation: Validate your DFD against the actual system architecture. Have developers review the DFD for accuracy. Use multiple threat modeling techniques (DFD + attack trees, or DFD + PASTA) for high-risk systems.
Conclusion
DFDs are dynamic documents that should evolve with your system. Keep them updated, share them with your team, and utilize them as a guiding compass through the ever-changing security landscape.
So, armed with your metaphorical markers, start mapping with DFDs. Illuminate potential vulnerabilities, build secure systems, sleep soundly knowing your data flows safely, and impress your fellow security nerds along the way. Upskill in Threat Modeling